Old Dominion Freight Line is the second-largest less-than-truckload carrier in the United States (following FedEx Freight), with roughly 260 service centers and 11,000-plus tractors. It is one of the most disciplined and efficient providers in the trucking industry, and its profitability and capital returns are well above those of its peers. Strategic initiatives focus on increasing network density through market-share gains and on maintaining industry-leading service (including ultralow cargo claims) through steadfast infrastructure investment.
The chart shows the growth of an initial investment of $10,000 in Old Dominion Freight Line, comparing it to the performance of the S&P 500 index. All prices have been adjusted for splits and dividends.
Returns By Period
Old Dominion Freight Line (ODFL) has returned 25.52% so far this year and 30.03% over the past 12 months. Looking at the last ten years, ODFL has achieved an annualized return of 23.99%, outperforming the Benchmark (SPY), which averaged 12.23% per year.
ODFL
1M-7.21%
6M39.91%
YTD25.52%
1Y30.03%
5Y9.70%
10Y23.99%
Benchmark (SPY)
1M-3.85%
6M-2.35%
YTD-4.36%
1Y34.06%
5Y9.80%
10Y12.23%
Monthly Returns
The table below presents the monthly returns of Old Dominion Freight Line (ODFL) with color gradation from worst to best to easily spot seasonal factors.
Jan
Feb
Mar
Apr
May
Jun
Jul
Aug
Sep
Oct
Nov
Dec
2026
9.79%
17.15%
-3.59%
1.71%
2025
3.73%
-6.18%
-7.14%
-6.35%
4.78%
0.22%
-7.90%
1.91%
-5.29%
0.77%
-3.52%
14.96%
2024
-3.05%
14.76%
-1.11%
-17.25%
-2.77%
0.04%
19.31%
-8.50%
3.69%
2.03%
12.40%
-22.10%
2023
16.51%
-3.07%
0.36%
-5.41%
-3.13%
18.78%
14.06%
1.88%
-5.64%
-7.32%
2.91%
4.45%
2022
-15.68%
3.04%
-4.20%
-6.43%
-7.95%
-0.74%
19.09%
-9.53%
-7.54%
9.38%
9.13%
-6.12%
2021
-0.58%
9.01%
10.43%
7.30%
2.57%
-5.52%
5.91%
7.24%
-1.36%
18.73%
3.32%
-0.38%
2020
3.14%
-1.94%
2.06%
14.43%
19.46%
-0.25%
6.91%
10.39%
-10.51%
4.34%
4.89%
-4.20%
2019
12.11%
11.00%
-4.81%
2.24%
-11.11%
13.03%
11.11%
-1.68%
5.04%
6.47%
4.32%
-0.74%
2018
11.17%
-4.95%
5.50%
-8.70%
16.53%
-5.48%
-1.19%
3.67%
6.32%
-19.75%
4.21%
-11.36%
2017
1.87%
3.23%
-7.50%
3.48%
0.27%
6.38%
0.24%
3.78%
9.93%
10.01%
5.95%
1.60%
2016
-4.30%
-2.66%
-5.29%
15.48%
1.98%
-3.80%
8.72%
16.40%
-2.17%
Performance Indicators
The charts below present risk-adjusted performance metrics for Old Dominion Freight Line (ODFL) and compare them to a Benchmark (SPY). These indicators evaluate an investment's returns against its associated risks.
Sharpe ratio
Sortino ratio
Omega ratio
Calmar ratio
Martin ratio
sharpe ratio
The Sharpe ratio helps investors understand how much return they're getting for the level of risk taken. A higher Sharpe ratio indicates better risk-adjusted performance, meaning more reward for each unit of risk.
These values reflect how efficiently the investment has delivered returns relative to its volatility over different time periods. All figures are annualized and based on daily total returns.
The chart below shows the rolling Sharpe ratio of ODFL compared to the benchmark. This view highlights how the investment's risk-adjusted performance has changed over time.
Volatility Chart
The current Old Dominion Freight Line volatility is 2.77%, representing the standart deviation of percentage change in the investments's value, either up or down over the past month. The chart below shows the rolling one-month volatility.
Drawdowns Chart
The Drawdowns chart displays portfolio losses from any high point along the way. It shows the maximum percentage drop from a peak to a trough over a specified period, indicating the risk of significant losses. Although chart shows positive values, it represents the percentage drop from the peak, so a value of 10% means the portfolio has dropped 10% from its highest point.
Income Statement
The income statement provides a summary of a company's revenues, expenses, and profits over a specific period. It shows how much money the company earned (revenues) and how much it spent (expenses), leading to the net income or profit. This statement is crucial for understanding a company's financial performance and profitability.
2025
2024
2023
2022
2021
2020
2019
2018
2017
2016
2015
2014
2013
2012
2011
2010
Liabilities And Equity (USD)
5.47B
5.49B
5.51B
4.84B
4.82B
4.37B
4.00B
3.55B
3.07B
2.70B
2.47B
2.24B
1.93B
1.71B
1.51B
1.24B
Equity Attributable To Parent (USD)
4.31B
4.24B
4.26B
3.65B
3.68B
3.33B
3.08B
2.68B
2.28B
1.85B
1.68B
1.49B
1.23B
1.03B
856.52M
668.65M
Equity Attributable To Noncontrolling Interest (USD)
Three weeks into the Iran war, markets are repositioning for a prolonged conflict lasting months rather than days. A 32-percentage-point divergence has emerged between stocks benefiting from a closed Strait of Hormuz (energy, defense, drones) which are up 17.55% on average, and those needing it open (airlines, cruise lines, logistics) which are down 15.35% on average. Prediction markets assign only a 26% probability of normal traffic returning by April 30, suggesting at least six more weeks of disruption.
Benzinga•Piero Cingari
AI Insight
Down 9.18% as freight disruption impacts LTL operations
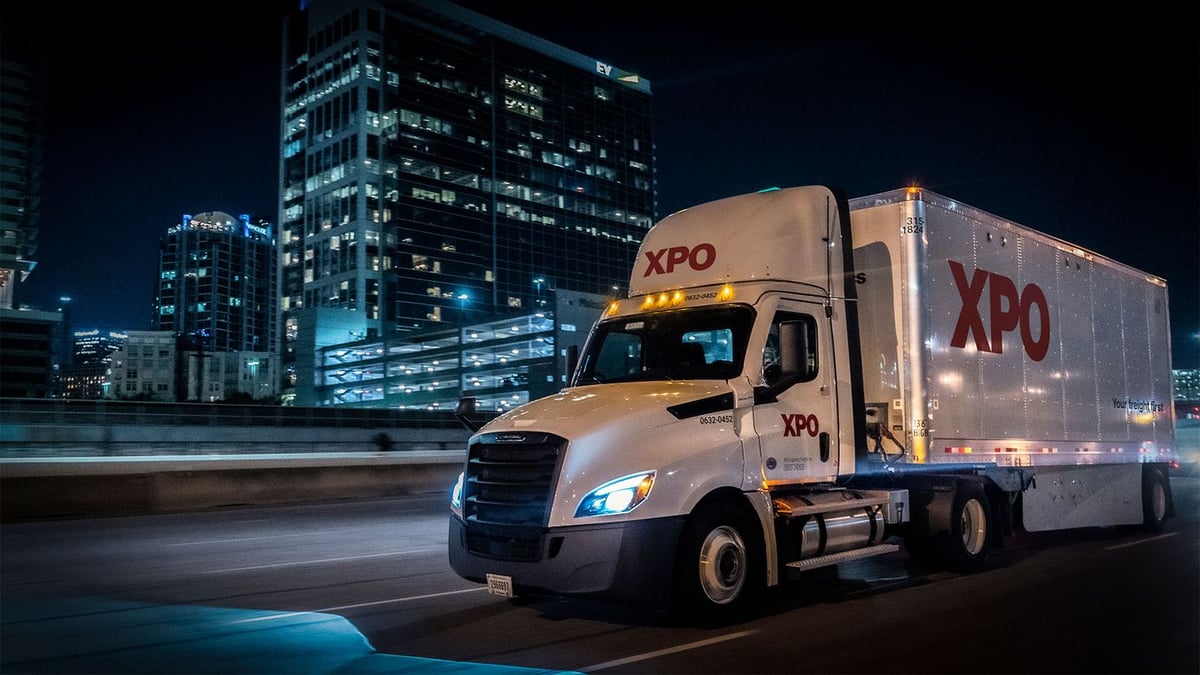
XPO, a leading less-than-truckload carrier, has surged 40% year-to-date following strong Q4 earnings and an ISM manufacturing report showing expansion for the first time in over two years. The company beat revenue and EPS estimates while improving operational margins. With manufacturing volumes estimated 15-17% below normalized levels, a recovery could significantly boost XPO's revenue and profits, though the stock's P/E ratio of 50 suggests recovery tailwinds are already priced in.
The Motley Fool•Jeremy Bowman
AI Insight
Mentioned as a sector leader expressing optimism for 2026, which helped catalyze the broader LTL industry rally including XPO. The positive sector sentiment benefits the company.
Old Dominion Freight Line (NASDAQ: ODFL) stock rose Wednesday after reporting Q4 2025 results that beat earnings expectations despite challenging market conditions. Revenue fell 5.7% YoY to $1.307 billion due to a 10.7% decline in LTL tons per day, but the company demonstrated pricing power with a 4.9% increase in LTL revenue per hundredweight excluding fuel surcharges. EPS of $1.09 exceeded Street estimates of $1.06, and the company increased its quarterly dividend by 3.6%.
Benzinga•Lekha Gupta
AI Insight
Stock gained on earnings beat with EPS of $1.09 exceeding estimates of $1.06. Despite revenue decline, the company demonstrated pricing power with 4.9% increase in LTL revenue per hundredweight. Dividend increased 3.6% YoY, and management maintained commitment to revenue quality and cost discipline in a challenging environment. Strong cash generation and shareholder returns support positive outlook.
XPO delivered strong Q3 earnings, beating estimates and improving operating margins through AI-driven productivity enhancements, despite challenging macroeconomic conditions in the trucking and manufacturing sectors.
The Motley Fool•Jeremy Bowman
AI Insight
Mentioned as a competitor, minimal performance details provided
Old Dominion Freight Line reported Q3 2025 earnings of $1.28 per share, beating estimates despite a 4.3% revenue decline and challenging freight market conditions. The company maintained profitability through strategic pricing and cost management.
Benzinga•Lekha Gupta
AI Insight
Mixed financial performance with earnings beating estimates but experiencing revenue decline and reduced shipping volumes, indicating resilience in a challenging market
Despite high market valuations, selective stock investing remains viable. Two recommended stocks are Lululemon and Old Dominion Freight Line, which offer balanced risk-reward, while Palantir serves as a cautionary example of overvaluation.
The Motley Fool•Daniel Sparks
AI Insight
Experiencing soft industrial demand but maintaining strategic focus, with potential for recovery in 2026 volumes and pricing
Wall Street analysts highlight three trucking stocks - Saia, Old Dominion Freight Line, and XPO Logistics - as potentially undervalued, with significant upside potential due to current market discounts and potential benefits from trade tariffs.
Investing.com•Gabriel Osorio-Mazzilli
AI Insight
Missed quarterly EPS estimates but analysts project future EPS growth, trading at 62% of 52-week high with potential 20% upside due to Canadian trade route exposure
XPO Logistics reported flat revenue of $2.08 billion in Q2, with challenges in the North American less-than-truckload (LTL) market offset by strategic improvements in pricing, service quality, and local market growth.
The Motley Fool•Jeremy Bowman
AI Insight
Mentioned as a peer facing similar industry headwinds in the freight market
Goldman Sachs maintains a Neutral rating on Old Dominion Freight Line, anticipating a decline in revenue per day and tonnage for Q2, but expects margin improvement. The analyst is awaiting updates on April revenue trends during the earnings call.
Benzinga•Lekha Gupta
AI Insight
Goldman Sachs maintains a Neutral rating on the stock, citing expectations of a decline in revenue per day and tonnage for Q2, but anticipates margin improvement.
Old Dominion Freight Line reported a decline in revenue but beat earnings estimates, with the CEO citing ongoing economic softness. The company's financial results reflect the challenging economic environment.
Benzinga•Lekha Gupta
AI Insight
The company reported a decline in revenue but beat earnings estimates, indicating a mixed performance. The CEO cited ongoing economic softness, suggesting a challenging environment.