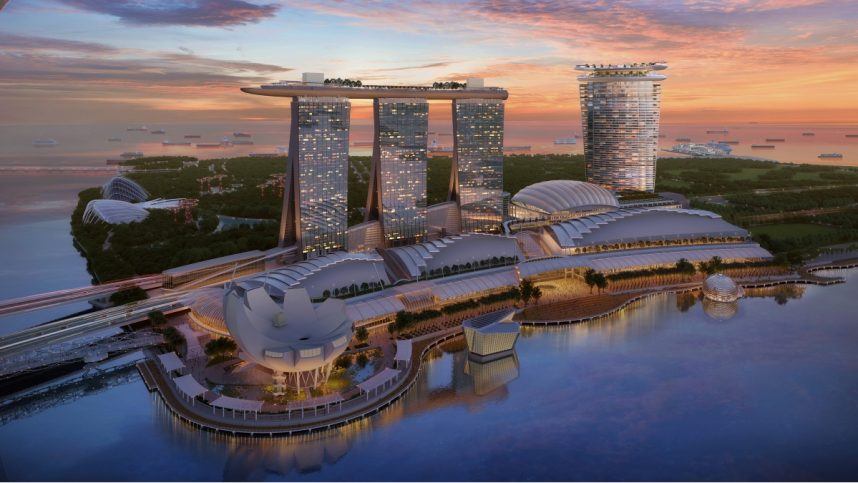
Las Vegas Sands is the world's largest operator of fully integrated resorts, featuring casino, hotel, entertainment, food and beverage, retail, and convention center operations. The company owns the Venetian Macao, Sands Macao, Londoner Macao, Four Seasons Hotel Macao, and Parisian Macao, as well as the Marina Bay Sands resort in Singapore. We expect Sands to open a fourth tower in Singapore in 2031. Its Venetian and Palazzo Las Vegas assets in the US were sold to Apollo and Vici in 2022. After the sale of its Vegas assets, Sands generates all its EBITDA from Asia, with its casino operations generating the majority of sales.
The chart shows the growth of an initial investment of $10,000 in Las Vegas Sands Corp., comparing it to the performance of the S&P 500 index. All prices have been adjusted for splits and dividends.
Returns By Period
Las Vegas Sands Corp. (LVS) has returned -16.66% so far this year and 67.92% over the past 12 months. Looking at the last ten years, LVS has achieved an annualized return of 0.54%, underperforming the Benchmark (SPY), which averaged 12.23% per year.
LVS
1M-2.69%
6M5.25%
YTD-16.66%
1Y67.92%
5Y-2.52%
10Y0.54%
Benchmark (SPY)
1M-3.85%
6M-2.35%
YTD-4.36%
1Y34.06%
5Y9.80%
10Y12.23%
Monthly Returns
The table below presents the monthly returns of Las Vegas Sands Corp. (LVS) with color gradation from worst to best to easily spot seasonal factors.
Jan
Feb
Mar
Apr
May
Jun
Jul
Aug
Sep
Oct
Nov
Dec
2026
-19.13%
5.90%
-3.20%
0.30%
2025
-10.56%
0.52%
-16.78%
-5.07%
11.91%
3.37%
14.41%
10.81%
-5.42%
10.17%
13.34%
-6.05%
2024
0.02%
9.17%
-3.18%
-15.26%
1.97%
-2.15%
-9.98%
-1.71%
29.64%
2.71%
1.26%
-4.38%
2023
19.70%
-3.65%
-1.64%
7.11%
-14.38%
5.99%
2.43%
-7.17%
-17.23%
4.17%
-2.78%
6.70%
2022
15.20%
-2.24%
-8.50%
-10.30%
-0.23%
-5.99%
11.67%
0.86%
0.91%
0.42%
19.28%
3.38%
2021
-19.58%
27.76%
-5.78%
-0.05%
-5.82%
-10.07%
-19.87%
4.01%
-18.90%
4.10%
-8.38%
3.69%
2020
-6.54%
-11.80%
-27.89%
19.10%
4.01%
-6.14%
-4.40%
17.44%
-8.02%
3.44%
14.37%
5.32%
2019
14.50%
5.30%
-1.65%
7.37%
-18.88%
8.42%
-2.85%
-8.27%
6.12%
6.62%
0.66%
10.11%
2018
12.35%
-6.22%
-0.83%
0.87%
9.09%
-3.94%
-1.24%
-8.91%
-9.16%
-13.54%
7.10%
-10.47%
2017
-1.94%
1.46%
4.43%
1.74%
-0.25%
7.27%
-2.67%
0.18%
1.84%
0.44%
6.60%
-0.29%
2016
-11.24%
-0.41%
-3.53%
16.17%
-0.61%
10.72%
-2.06%
7.16%
-14.63%
Performance Indicators
The charts below present risk-adjusted performance metrics for Las Vegas Sands Corp. (LVS) and compare them to a Benchmark (SPY). These indicators evaluate an investment's returns against its associated risks.
Sharpe ratio
Sortino ratio
Omega ratio
Calmar ratio
Martin ratio
sharpe ratio
The Sharpe ratio helps investors understand how much return they're getting for the level of risk taken. A higher Sharpe ratio indicates better risk-adjusted performance, meaning more reward for each unit of risk.
These values reflect how efficiently the investment has delivered returns relative to its volatility over different time periods. All figures are annualized and based on daily total returns.
The chart below shows the rolling Sharpe ratio of LVS compared to the benchmark. This view highlights how the investment's risk-adjusted performance has changed over time.
Volatility Chart
The current Las Vegas Sands Corp. volatility is 1.72%, representing the standart deviation of percentage change in the investments's value, either up or down over the past month. The chart below shows the rolling one-month volatility.
Drawdowns Chart
The Drawdowns chart displays portfolio losses from any high point along the way. It shows the maximum percentage drop from a peak to a trough over a specified period, indicating the risk of significant losses. Although chart shows positive values, it represents the percentage drop from the peak, so a value of 10% means the portfolio has dropped 10% from its highest point.
Income Statement
The income statement provides a summary of a company's revenues, expenses, and profits over a specific period. It shows how much money the company earned (revenues) and how much it spent (expenses), leading to the net income or profit. This statement is crucial for understanding a company's financial performance and profitability.
2025
2024
2023
2022
2021
2020
2019
2018
2017
2016
2015
2014
2013
2012
2011
Liabilities And Equity (USD)
21.92B
20.67B
21.78B
22.04B
20.06B
20.81B
23.20B
22.55B
20.69B
20.47B
20.99B
22.36B
22.72B
22.16B
22.24B
Equity Attributable To Parent (USD)
1.59B
2.88B
4.12B
3.88B
2.00B
2.97B
5.19B
5.68B
6.49B
6.18B
6.82B
7.21B
7.67B
7.06B
7.85B
Equity Attributable To Noncontrolling Interest (USD)
The article recommends three dividend stocks for long-term income investors seeking to reduce volatility amid economic uncertainty. PepsiCo is praised for 54 years of consecutive dividend increases and strategic repositioning toward healthy products. McDonald's offers a 49-year dividend growth streak with 9% expected annual growth and renewed focus on value pricing. Las Vegas Sands, a casino operator, presents a speculative option with restored and growing dividends, backed by profitable operations and investment-grade credit ratings.
The Motley Fool•Todd Shriber
AI Insight
Dividend restored in 2023 with two subsequent increases, operates world's most profitable casino (Marina Bay Sands), strong cash flow generation, investment-grade credit ratings rare in casino industry, and active share buyback program.
Microsoft experienced its worst trading day since March 2020, plunging 12% and erasing $400 billion in market cap despite beating earnings expectations, as investors focused on slowing Azure cloud growth and cautious AI monetization guidance. The selloff dragged major tech indices lower, with the S&P 500 down 1% and Nasdaq 100 down 1.6%. Bitcoin fell 5% to $85,000, while travel stocks surged and Meta bucked the tech weakness with strong earnings.
Benzinga•Piero Cingari
AI Insight
Stock sank 13.5% after issuing weak guidance tied to softer trends in Macau.
Las Vegas Sands beat Q4 analyst estimates with $3.649 billion in revenue (vs. $3.328 billion estimate) and $0.85 EPS (vs. $0.76 estimate), with adjusted property EBITDA growing to $1.41 billion. However, the stock fell 8.59% in after-hours trading, driven by concerns about declining margins and net income in the Macao segment despite strong Singapore operations.
Benzinga•Chris Katje
AI Insight
Despite beating revenue and EPS estimates, the stock declined 8.59% in after-hours trading due to investor concerns about deteriorating margins and net income in the Macao segment, which offset strong Singapore performance. The market appears to have focused on profitability concerns rather than top-line beats.
The global casino hotel market is projected to grow from $213.09 billion in 2026 to $285.84 billion by 2032, with a CAGR of 4.9%. Growth is driven by digital transformation, personalized guest experiences, and ecosystem-centric business models. Regional strategies must adapt to local regulations and consumer preferences, while operators focus on digital innovation and supply chain resilience.
GlobeNewswire Inc.•Researchandmarkets.Com
AI Insight
Major operator in the growing market with opportunities to leverage digital ecosystems and regional expansion strategies highlighted in the forecast.
Ten large-cap stocks experienced significant declines during the week of January 5-9, 2026. Notable losers include Madrigal Pharmaceuticals (down 11.57%), First Solar (down 14.46% following a Jefferies downgrade), Astera Labs (down 12.18%), and Roblox (down 9.99%). Other major decliners include CoStar Group, American International Group, NRG Energy, Las Vegas Sands, Johnson Controls International, and HDFC Bank. The declines were driven by analyst downgrades, leadership transitions, and executive changes.
Benzinga•Nabaparna Bhattacharya
AI Insight
Stock fell 9.57% during the week with no specific catalyst mentioned in the article.
Las Vegas Sands, a major casino operator, derives significant value from its Marina Bay Sands property in Singapore, which is considered one of the world's most profitable casinos. Despite primarily being viewed as a Macao-focused company, its Singapore asset is potentially undervalued by investors.
The Motley Fool•Todd Shriber
AI Insight
The article highlights strong financial performance of Marina Bay Sands, with potential annual EBITDA of $2.7-$2.9 billion, and suggests the stock is undervalued given the Singapore property's worth
Las Vegas Sands reported strong Q3 2025 earnings, with 24% revenue growth and 66% increase in net income, significantly outperforming analyst expectations by focusing on Asian gaming markets in Macao and Singapore.
The Motley Fool•Eric Volkman
AI Insight
Company exceeded quarterly earnings expectations with substantial revenue growth (24%), net income increase (66%), and strong performance in Macao and Singapore properties, leading to a 12.24% stock price surge
Las Vegas Sands reported strong Q3 2025 financial performance with net revenue of $3.33 billion, net income of $491 million, and consolidated adjusted property EBITDA of $1.34 billion. The company remains optimistic about growth opportunities in Macao and Singapore.
Benzinga•Prnewswire
AI Insight
Strong quarterly financial performance, increased revenue and net income compared to previous year, optimistic growth outlook, share repurchase program, and dividend increase
Singapore-based Ten-League International Holdings reported strong financial performance for the first half of fiscal year 2025, with revenue increasing 21.6% to S$37.7 million and net income rising 268.9% to S$2.4 million, driven by infrastructure project demand and improved operational efficiency.
GlobeNewswire Inc.•Ten-League International Holdings Limited
AI Insight
Referenced as an infrastructure project contributing to company's revenue growth
Las Vegas Sands reported strong Q2 2025 financial results, with earnings and revenue exceeding expectations, driven by robust performance at Marina Bay Sands in Singapore and mixed results in Macao.
The Motley Fool•Jesterai
AI Insight
Exceeded earnings and revenue expectations, with 15% revenue growth, record performance at Marina Bay Sands, strong cash flow, and continued capital returns through stock buybacks and maintained dividend