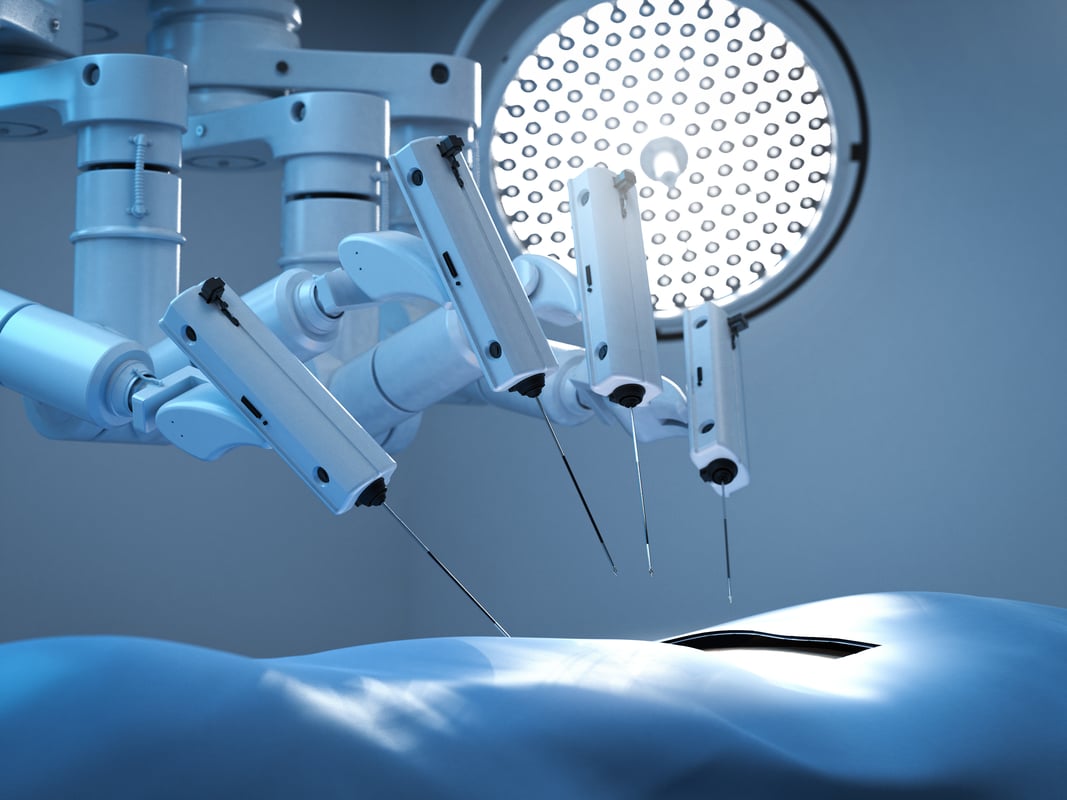
Intuitive develops, produces, and markets a robotic system for assisting minimally invasive surgery. It also provides the instrumentation, disposable accessories, and warranty services for the system. The company has placed more than 10,000 da Vinci systems in hospitals worldwide, with more than 6,000 installations in the US and a growing number in emerging markets.
The chart shows the growth of an initial investment of $10,000 in Intuitive Surgical Inc., comparing it to the performance of the S&P 500 index. All prices have been adjusted for splits and dividends.
Returns By Period
Intuitive Surgical Inc. (ISRG) has returned -20.24% so far this year and 4.90% over the past 12 months. Looking at the last ten years, ISRG has achieved an annualized return of 20.95%, outperforming the Benchmark (SPY), which averaged 12.23% per year.
ISRG
1M-8.71%
6M-1.66%
YTD-20.24%
1Y4.90%
5Y11.75%
10Y20.95%
Benchmark (SPY)
1M-3.85%
6M-2.35%
YTD-4.36%
1Y34.06%
5Y9.80%
10Y12.23%
Monthly Returns
The table below presents the monthly returns of Intuitive Surgical Inc. (ISRG) with color gradation from worst to best to easily spot seasonal factors.
Jan
Feb
Mar
Apr
May
Jun
Jul
Aug
Sep
Oct
Nov
Dec
2026
-11.04%
0.30%
-6.42%
-2.34%
2025
9.73%
1.47%
-13.68%
4.78%
6.60%
-1.03%
-11.33%
-0.46%
-4.96%
19.53%
7.79%
-0.46%
2024
13.58%
1.90%
4.07%
-7.11%
8.81%
10.41%
-0.28%
11.13%
-0.08%
2.30%
7.96%
-4.46%
2023
-8.87%
-7.05%
11.82%
18.45%
2.27%
11.02%
-4.57%
-2.89%
-7.95%
-10.19%
18.56%
8.62%
2022
-20.76%
1.81%
4.04%
-21.28%
-5.15%
-11.87%
14.47%
-9.49%
-8.05%
30.13%
9.00%
-1.86%
2021
-9.47%
-2.02%
-1.35%
15.33%
-3.58%
7.84%
8.06%
5.78%
-5.77%
8.99%
-10.33%
9.34%
2020
-6.03%
-5.04%
-7.60%
11.00%
15.31%
-0.86%
19.83%
6.58%
-3.13%
-6.45%
6.67%
11.56%
2019
11.53%
4.74%
3.41%
-11.19%
-9.14%
13.33%
-2.35%
-1.76%
6.87%
2.41%
6.36%
-0.14%
2018
17.34%
-1.42%
-3.64%
6.92%
4.47%
3.61%
6.66%
9.71%
2.68%
-9.38%
1.54%
-11.62%
2017
8.92%
6.80%
4.03%
9.17%
9.07%
2.22%
-0.29%
7.00%
4.39%
7.34%
5.96%
-8.44%
2016
5.24%
1.10%
4.61%
5.17%
-1.09%
5.53%
-6.86%
-4.41%
-1.29%
Performance Indicators
The charts below present risk-adjusted performance metrics for Intuitive Surgical Inc. (ISRG) and compare them to a Benchmark (SPY). These indicators evaluate an investment's returns against its associated risks.
Sharpe ratio
Sortino ratio
Omega ratio
Calmar ratio
Martin ratio
sharpe ratio
The Sharpe ratio helps investors understand how much return they're getting for the level of risk taken. A higher Sharpe ratio indicates better risk-adjusted performance, meaning more reward for each unit of risk.
These values reflect how efficiently the investment has delivered returns relative to its volatility over different time periods. All figures are annualized and based on daily total returns.
The chart below shows the rolling Sharpe ratio of ISRG compared to the benchmark. This view highlights how the investment's risk-adjusted performance has changed over time.
Volatility Chart
The current Intuitive Surgical Inc. volatility is 1.45%, representing the standart deviation of percentage change in the investments's value, either up or down over the past month. The chart below shows the rolling one-month volatility.
Drawdowns Chart
The Drawdowns chart displays portfolio losses from any high point along the way. It shows the maximum percentage drop from a peak to a trough over a specified period, indicating the risk of significant losses. Although chart shows positive values, it represents the percentage drop from the peak, so a value of 10% means the portfolio has dropped 10% from its highest point.
Income Statement
The income statement provides a summary of a company's revenues, expenses, and profits over a specific period. It shows how much money the company earned (revenues) and how much it spent (expenses), leading to the net income or profit. This statement is crucial for understanding a company's financial performance and profitability.
2025
2024
2023
2022
2021
2020
2019
2018
2017
2016
2015
2014
2013
2012
2011
2009
Liabilities And Equity (USD)
20.46B
18.74B
15.44B
12.97B
13.56B
11.17B
9.73B
7.85B
5.76B
6.49B
4.91B
3.96B
3.95B
4.06B
3.06B
1.81B
Equity Attributable To Parent (USD)
17.82B
16.43B
13.31B
11.04B
11.90B
9.73B
8.26B
6.68B
4.73B
5.78B
4.32B
3.38B
3.50B
3.58B
2.65B
1.54B
Equity Attributable To Noncontrolling Interest (USD)
Intuitive Surgical faces near-term headwinds from tariffs and increased competition in the robotic-assisted surgery market from Medtronic and Johnson & Johnson. Despite trading at a premium valuation of 47.6x forward earnings, the company's strong competitive moat, expanding market opportunity, and consistent financial growth position it as an attractive long-term investment for buy-and-hold investors willing to tolerate near-term volatility.
The Motley Fool•Prosper Junior Bakiny
AI Insight
Despite near-term challenges from tariffs and competition, the company demonstrates strong financial fundamentals (19% revenue growth, 14.5% EPS growth), a wide competitive moat with high switching costs, expanding market opportunity in robotic-assisted surgery, and pricing power to offset tariff impacts. Recommended as a buy for long-term investors.
Elon Musk announced Terafab, a $25 billion joint venture between Tesla, SpaceX, and XAI to build a vertically integrated semiconductor factory producing 1 terawatt of AI computing power annually. The facility aims to address supply chain bottlenecks and support Tesla's robotaxi and humanoid robot ambitions, plus SpaceX's orbital AI satellite constellation. While ambitious, industry experts question feasibility given the complexity of chip fabrication and Musk's mixed track record on delivery timelines.
The Motley Fool•Motley Fool Staff
AI Insight
Highlighted as leader in physical AI and surgical robotics, representing a secular growth trend in healthcare automation and personalized medicine.
The article recommends two defensive healthcare stocks for portfolio protection during market uncertainty: Abbott Laboratories, a diversified healthcare company with four business units and a 50+ year dividend growth track record, and Intuitive Surgical, the global leader in robotic surgery with strong competitive advantages through surgeon training and recurring accessory revenue.
The Motley Fool•Adria Cimino
AI Insight
Recommended as a solid defensive holding due to its global leadership in robotic surgery, strong competitive moat (surgeon training on Da Vinci systems and high capital investment barriers for hospitals), and recurring revenue from accessories and instruments, making it resilient during market downturns.
The FDA issued an early alert regarding a safety issue with Intuitive Surgical's curved-tip stapler devices used in the da Vinci Surgical System. The devices have failed to form complete staple lines during procedures involving blood vessels, potentially causing unintended tissue cutting and severe bleeding. As of February 23, 2026, four serious injuries and one death have been reported. Intuitive Surgical has advised healthcare providers to remove affected devices from use and switch to alternative surgical tools.
Benzinga•Vandana Singh
AI Insight
The company faces a significant safety issue with its stapler devices, resulting in reported deaths and serious injuries. The FDA alert requires device removal from use, which impacts product reliability and poses reputational and potential legal/financial risks. However, the stock showed minimal movement (-0.02%), suggesting the market may be pricing in limited near-term impact.
The global surgical stapling devices market was valued at USD 5.47 billion in 2025 and is projected to reach USD 10.14 billion by 2035, growing at a 7.2% CAGR. Growth is driven by increasing surgical volumes, adoption of minimally invasive and robotic procedures, rising obesity and colorectal disease prevalence, and technological innovations in powered stapling systems. North America leads the market while Asia Pacific shows the fastest growth.
GlobeNewswire Inc.•Healthcare Foresights
AI Insight
Listed as a key market player positioned to benefit from the growing adoption of robotic-assisted surgical procedures, which is a primary driver of surgical stapling device demand.
Intuitive Surgical reported strong Q4 2025 results with 19% revenue growth and 18% procedure volume growth, but management guided for a notable deceleration to 13-15% procedure growth in 2026. While the business fundamentals remain solid, the stock's valuation at 63x earnings leaves little room for error. The analyst recommends holding for current shareholders but staying on the sidelines for new investors, with interest only at a 45x earnings valuation.
The Motley Fool•Daniel Sparks
AI Insight
Despite excellent business fundamentals with strong revenue growth (19% YoY) and procedure volume growth (18% YoY), the stock receives a negative rating due to its sky-high valuation at 63x earnings. Management's guidance for a deceleration in 2026 (13-15% growth) combined with the premium valuation leaves minimal margin of safety and significant downside risk if the market reprices the stock. The analyst explicitly states they are 'not interested in buying the stock at this price.'
Despite facing recent headwinds, Intuitive Surgical and DexCom are positioned for strong long-term growth. Intuitive Surgical benefits from aging population trends and a wide competitive moat despite new competition from Medtronic's Hugo system. DexCom has significant untapped market potential with millions of uninsured diabetes patients and expanding into non-diabetic markets with products like Stelo.
The Motley Fool•Prosper Junior Bakiny
AI Insight
Despite 13% decline over trailing 12 months and new competition from Medtronic's Hugo system, the company has strong secular tailwinds from aging population, wide competitive moat, pricing power, and growing installed base of 11,106 da Vinci devices. Well-positioned for decade-long outperformance.
The article recommends two healthcare dividend stocks: Becton, Dickinson (BDX), a Dividend King with 50+ years of consecutive dividend increases and a 2.4% yield, and Medtronic (MDT), an aspiring Dividend King with a 2.9% yield and new surgical robotics growth potential. Both stocks are trading below $1,000 and currently out of favor with Wall Street, presenting potential buying opportunities for long-term dividend investors.
The Motley Fool•Reuben Gregg Brewer
AI Insight
Mentioned as the surgical robotics market leader with high valuation (63x P/E), used as a comparison point to highlight Medtronic's undervaluation and growth opportunity potential.
Medtronic has just received FDA approval for its Hugo surgical robot system in the U.S., positioning it as a potential growth opportunity similar to Intuitive Surgical's da Vinci system. With a P/E of 27 compared to Intuitive Surgical's 64, Medtronic appears undervalued and could see significant upside if Hugo achieves similar adoption rates. The company also offers a 2.9% dividend yield with decades of increases, making it attractive for dividend investors.
The Motley Fool•Reuben Gregg Brewer
AI Insight
Established market leader with 11,100+ da Vinci robots installed worldwide and 75% recurring revenue from services and accessories. However, trading at a lofty P/E of 64, which is significantly higher than competitor Medtronic. Used as a comparison benchmark for evaluating Medtronic's potential rather than as a primary investment recommendation.
Medtronic is positioned as an attractive lifetime hold in the medical device sector, expanding into robotic surgery with FDA approval for its Hugo system. The company offers a compelling valuation (P/E of 16.3), a 48-year dividend increase streak with a 2.9% yield, and is spinning off its diabetes division to focus on faster-growing businesses. Recent Q3 results showed 8.7% revenue growth year-over-year.
The Motley Fool•Selena Maranjian
AI Insight
Acknowledged as a leader in robotic surgical systems with strong 19% average annual gains over 15 years, but shares are noted as expensive and no longer the only competitor in the space with Medtronic's entry.