Former U.S. Senator Sam Nunn visited HII's Ingalls Shipbuilding division to tour the construction progress of the future USS Sam Nunn (DDG 133), a Flight III Arleigh Burke-class destroyer named in his honor. The visit highlighted the ship's advancing construction toward launch and celebrated Nunn's legacy in defense policy. Ingalls continues building multiple Flight III destroyers with advanced radar and combat systems.
Huntington Ingalls Industries, Inc. (HII)
Common Stock · Currency in USD · XNYS
Huntington Ingalls Industries is the largest independent military shipbuilder in the US, spun out from Northrop Grumman in 2011. It operates three segments, two of which are storied shipyards: Ingalls produces non-nuclear-powered ships including amphibious landing ships and Arleigh Burke-class destroyers, while Newport News produces nuclear-powered ships as the only producer of Gerald Ford-class aircraft carriers and a major subcontractor on Virginia- and Columbia-class nuclear submarines. HII shares production of destroyers and nuclear submarines with General Dynamics' Bath Iron Works and Electric Boat shipyards, respectively. The company's mission technologies segment produces uncrewed sea vessels and provides a range of IT and other services to US government agencies.
Company Info
SIC3730
Composite FIGIBBG001KJ2HM9
CIK0001501585
IPOMar 22, 2011
Sectorship & boat building & repairing
Highlights
Market Cap$15.62B
EPS$14.76
P/E Ratio26.93
Revenue$12.55B
Gross Profit$12.77B
Net Income$580.00M
Employees44,000
WSO39,377,171
Phone(757) 380-2000
Related Tickers
Analysis
Share Price Chart
Performance Chart
The chart shows the growth of an initial investment of $10,000 in Huntington Ingalls Industries, Inc., comparing it to the performance of the S&P 500 index.
All prices have been adjusted for splits and dividends.
Returns By Period
Huntington Ingalls Industries, Inc. (HII) has returned 16.63% so far this year and 118.79% over the past 12 months. Looking at the last ten years, HII has achieved an annualized return of 11.18%, underperforming the Benchmark (SPY), which averaged 12.23% per year.
HII
1M-7.57%
6M38.70%
YTD16.63%
1Y118.79%
5Y13.82%
10Y11.18%
Benchmark (SPY)
1M-3.85%
6M-2.35%
YTD-4.36%
1Y34.06%
5Y9.80%
10Y12.23%
Monthly Returns
The table below presents the monthly returns of Huntington Ingalls Industries, Inc. (HII) with color gradation from worst to best to easily spot seasonal factors.
| Jan | Feb | Mar | Apr | May | Jun | Jul | Aug | Sep | Oct | Nov | Dec | |
|---|---|---|---|---|---|---|---|---|---|---|---|---|
| 2026 | 23.65% | 6.40% | -15.80% | 4.51% | ||||||||
| 2025 | 3.91% | -9.98% | 14.22% | 12.68% | -6.22% | 8.33% | 16.35% | -2.20% | 6.78% | 13.17% | -2.73% | 8.84% |
| 2024 | -0.06% | 10.46% | 0.25% | -5.15% | -9.05% | -3.47% | 12.91% | -0.15% | -6.36% | -29.99% | 6.91% | -4.57% |
| 2023 | -3.98% | -1.93% | -3.36% | -2.77% | -0.33% | 12.48% | 1.64% | -4.04% | -7.71% | 7.58% | 6.89% | 9.53% |
| 2022 | 0.22% | 9.70% | -2.51% | 6.57% | -0.43% | 2.52% | -0.66% | 6.07% | -3.38% | 14.64% | -9.95% | -0.99% |
| 2021 | -7.26% | 11.33% | 15.59% | 3.07% | 1.41% | -3.72% | -3.28% | -0.78% | -5.41% | 4.47% | -12.55% | 3.74% |
| 2020 | 3.57% | -21.74% | -12.22% | 9.63% | 6.00% | -12.63% | -1.39% | -12.93% | -6.22% | 4.77% | 7.20% | 4.62% |
| 2019 | 10.04% | 0.83% | -1.52% | 6.63% | -8.26% | 9.57% | 0.83% | -0.48% | 2.47% | 6.12% | 10.76% | 0.08% |
| 2018 | 0.88% | 10.26% | -1.98% | -5.69% | -8.90% | -2.36% | 8.35% | 4.77% | 5.02% | -15.27% | -1.39% | -12.90% |
| 2017 | 4.84% | 12.07% | -8.36% | 0.40% | -2.51% | -5.43% | 10.60% | 3.25% | 5.62% | 2.35% | 3.64% | -2.47% |
| 2016 | 6.45% | 5.85% | 9.95% | 1.91% | -4.11% | -7.11% | 5.29% | 10.57% | 2.95% |
Performance Indicators
The charts below present risk-adjusted performance metrics for Huntington Ingalls Industries, Inc. (HII) and compare them to a Benchmark (SPY). These indicators evaluate an investment's returns against its associated risks.
Sharpe ratio
Sortino ratio
Omega ratio
Calmar ratio
Martin ratio
sharpe ratio
The Sharpe ratio helps investors understand how much return they're getting for the level of risk taken. A higher Sharpe ratio indicates better risk-adjusted performance, meaning more reward for each unit of risk.
These values reflect how efficiently the investment has delivered returns relative to its volatility over different time periods. All figures are annualized and based on daily total returns.
The chart below shows the rolling Sharpe ratio of HII compared to the benchmark. This view highlights how the investment's risk-adjusted performance has changed over time.
Volatility Chart
The current Huntington Ingalls Industries, Inc. volatility is 2.17%, representing the standart deviation of percentage change in the investments's value, either up or down over the past month. The chart below shows the rolling one-month volatility.
Drawdowns Chart
The Drawdowns chart displays portfolio losses from any high point along the way. It shows the maximum percentage drop from a peak to a trough over a specified period, indicating the risk of significant losses.
Although chart shows positive values, it represents the percentage drop from the peak, so a value of 10% means the portfolio has dropped 10% from its highest point.
Income Statement
The income statement provides a summary of a company's revenues, expenses, and profits over a specific period. It shows how much money the company earned (revenues) and how much it spent (expenses), leading to the net income or profit. This statement is crucial for understanding a company's financial performance and profitability.
| 2025 | 2023 | 2022 | 2021 | 2020 | 2019 | 2018 | 2017 | 2016 | 2015 | 2014 | 2013 | 2012 | 2011 | |
|---|---|---|---|---|---|---|---|---|---|---|---|---|---|---|
| Liabilities And Equity (USD) | 12.75B | 11.22B | 10.86B | 10.63B | 8.16B | 7.03B | 6.38B | 6.37B | 6.35B | 6.02B | 6.27B | 6.23B | 6.39B | 6.00B |
| Equity Attributable To Parent (USD) | 5.07B | 4.09B | 3.49B | 2.81B | 1.90B | 1.59B | 1.52B | 1.76B | 1.65B | 1.49B | 1.37B | 1.52B | 667.00M | 872.00M |
| Equity Attributable To Noncontrolling Interest (USD) | - | - | - | - | - | - | - | - | - | - | - | - | - | - |
| Equity (USD) | 5.07B | 4.09B | 3.49B | 2.81B | 1.90B | 1.59B | 1.52B | 1.76B | 1.65B | 1.49B | 1.37B | 1.52B | 667.00M | 872.00M |
| Other Non-current Liabilities (USD) | - | - | 1.57B | 2.09B | 2.34B | 2.27B | 1.76B | 1.95B | 2.08B | 1.99B | 1.89B | 1.53B | 2.51B | - |
| Long-term Debt (USD) | - | - | 2.91B | 3.30B | 1.69B | 1.29B | 1.28B | 1.28B | 1.28B | 1.27B | 1.70B | 1.78B | 1.83B | - |
| Noncurrent Liabilities (USD) | 4.63B | 4.09B | 4.47B | 5.39B | 4.03B | 3.55B | 3.04B | 3.23B | 3.36B | 3.26B | 3.59B | 3.31B | 4.34B | 3.76B |
| Other Current Liabilities (USD) | 2.49B | 2.48B | 2.25B | 1.82B | 1.77B | 1.39B | 1.27B | 1.02B | 1.03B | 957.00M | 1.04B | 1.06B | 1.01B | 992.00M |
| Accounts Payable (USD) | 556.00M | 554.00M | 642.00M | 603.00M | 460.00M | 497.00M | 562.00M | 375.00M | 316.00M | 317.00M | 269.00M | 337.00M | 377.00M | 380.00M |
| Current Liabilities (USD) | 3.05B | 3.03B | 2.90B | 2.43B | 2.23B | 1.89B | 1.83B | 1.39B | 1.34B | 1.27B | 1.31B | 1.39B | 1.38B | 1.37B |
| Liabilities (USD) | 7.68B | 7.12B | 7.37B | 7.82B | 6.26B | 5.44B | 4.87B | 4.62B | 4.70B | 4.53B | 4.90B | 4.70B | 5.73B | 5.13B |
| Other Non-current Assets (USD) | 5.57B | 5.04B | 4.91B | 4.73B | 2.74B | 2.41B | 2.12B | 1.96B | 2.22B | 1.91B | 1.93B | 1.65B | 1.87B | 1.70B |
| Fixed Assets (USD) | 3.73B | 3.30B | 3.20B | 3.11B | 2.98B | 2.83B | 2.52B | 2.22B | 1.99B | 1.83B | 1.79B | 1.90B | 2.03B | 2.03B |
| Noncurrent Assets (USD) | 9.30B | 8.34B | 8.11B | 7.84B | 5.71B | 5.25B | 4.64B | 4.18B | 4.21B | 3.74B | 3.72B | 3.55B | 3.91B | 3.73B |
| Current Assets (USD) | 3.45B | 2.88B | 2.75B | 2.79B | 2.44B | 1.79B | 1.75B | 2.20B | 2.14B | 2.28B | 2.55B | 2.68B | 2.48B | 2.27B |
| Assets (USD) | 12.75B | 11.22B | 10.86B | 10.63B | 8.16B | 7.03B | 6.38B | 6.37B | 6.35B | 6.02B | 6.27B | 6.23B | 6.39B | 6.00B |
News and Insights

Huntington Ingalls Industries (HII) shares traded lower in premarket on Thursday, down 4.61% to $375.20, despite announcing the successful launch of USS George M. Neal (DDG 131) destroyer. Technical analysis shows short-term weakness with the stock trading below its 20-day and 50-day moving averages, though it maintains strength above its 200-day SMA with a 91.93% 12-month return. The stock carries a Buy rating with an average price target of $315.56.
HII's Ingalls Shipbuilding division successfully launched the USS George M. Neal (DDG 131), the fourth Flight III Arleigh Burke-class destroyer, marking a major construction milestone. The ship features advanced radar systems and combat capabilities designed to counter 21st-century threats and will proceed to outfitting and sea trials.
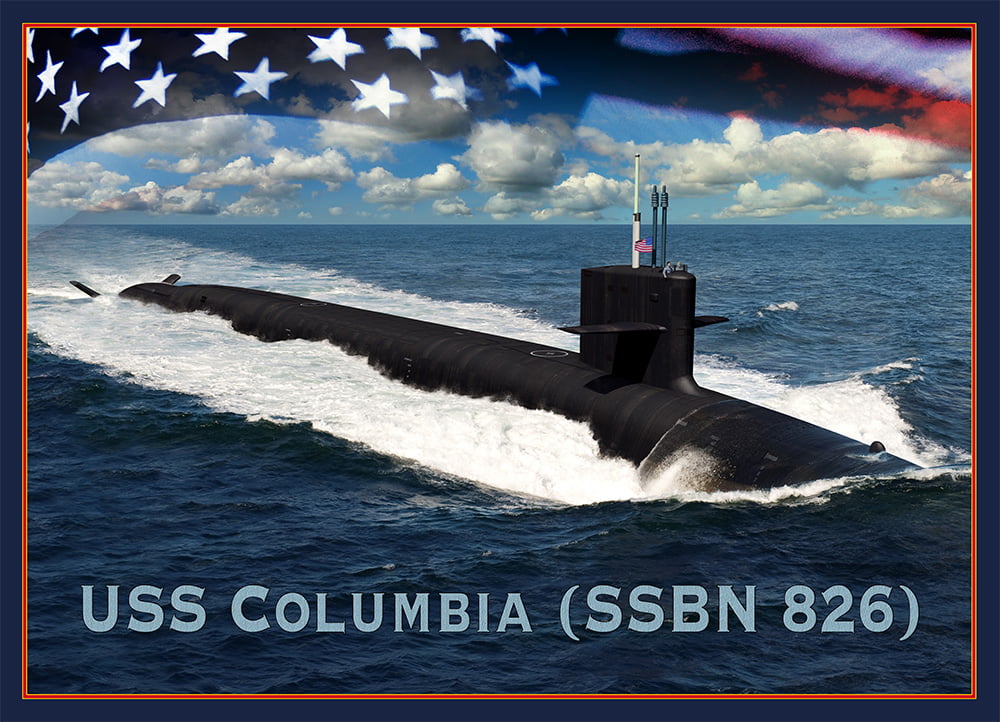
The U.S. Navy awarded General Dynamics a $15.4 billion contract to support construction of 12 Columbia-class nuclear ballistic missile submarines. The total program cost is estimated at $126.5 billion, with General Dynamics receiving 78% and Huntington Ingalls receiving 22%. The analyst suggests Huntington Ingalls may be a better value investment despite higher P/E ratio due to stronger earnings growth forecasts and superior free cash flow metrics.
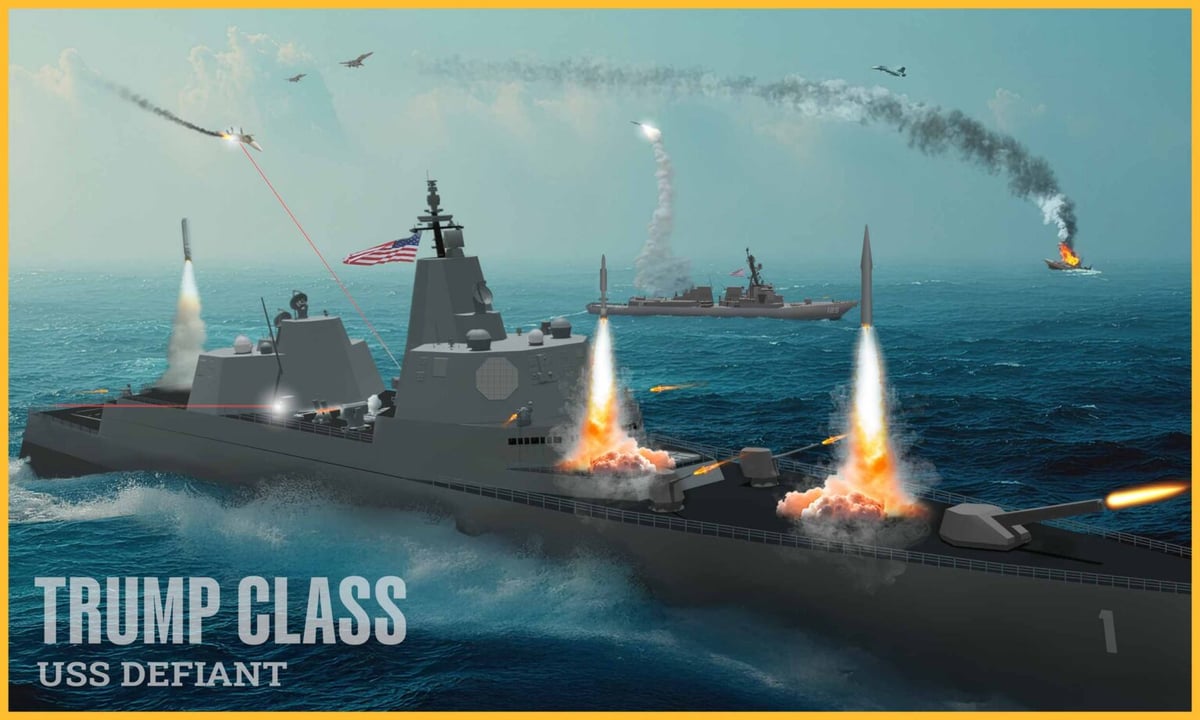
President Trump has ordered the Navy to build a new battleship (USS Defiant) equipped with electromagnetic railguns. The Pentagon has revived railgun development efforts, with BAE Systems currently leading prototype development in the U.S., while General Atomics has also expressed interest. The ship is expected to take over a decade to build, making it an early-stage investment opportunity for those interested in railgun technology stocks.
Nominal, a connected test and operations platform for complex hardware systems, announced a partnership with Forterra to support testing, validation, and mission operations for Forterra's AutoDrive autonomous driving system. The partnership provides unified data infrastructure for Forterra's production-rate delivery of autonomous ground vehicles deployed across defense operations, enabling faster validation and real-time field visibility.

Blue Water Autonomy, a Boston-based tech company, announced it will build uncrewed surface vessels (USVs) for the U.S. Navy starting in March 2026. The Liberty-class USVs are smaller (190 feet, 1,200 tons) compared to traditional Arleigh Burke-class destroyers, can be built in under a year, require no crew, and can carry 16-32 missiles. Partnering with Conrad Industries in Louisiana, Blue Water aims to produce 10-20 vessels annually, potentially helping the Navy reach President Trump's goal of 355+ ships faster and more cost-effectively than traditional large defense contractors.

America Will Build 11 New Icebreakers -- but Not a Single Big Defense Contractor Got a Contractnegative
The U.S. Coast Guard awarded $14 billion in contracts to build 14 new icebreakers to address the long-standing 'icebreaker gap' with Russia. Notably, major defense contractors like General Dynamics and Huntington Ingalls were shut out entirely. Instead, contracts went to smaller, privately-held shipbuilders including Bollinger Shipyards, Davie Defense, Rauma Marine Constructions, and others. The article suggests Bollinger's significant contract volume might make it a candidate for a future IPO.
Congress approved an $839 billion defense spending bill for fiscal 2026, allocating $9.8 billion toward autonomous and unmanned systems development. The global AI in defense and aerospace market is projected to grow from $4.2 billion in 2026 to $42.8 billion by 2036 at a 26.4% CAGR. Major defense contractors including Howmet Aerospace, Curtiss-Wright, Parsons, and HII secured significant contracts and partnerships to support military modernization and AI integration initiatives.

Tech stocks face a severe selloff with major indices suffering significant losses. However, defensive sectors like healthcare, energy, financials, and materials are showing resilience. Investors are rotating into undervalued, dividend-rich stocks and sectors less exposed to AI hype, with recommendations including healthcare, nuclear energy, and industrial stocks.